THE HOTTEST SUMMER ON RECORD
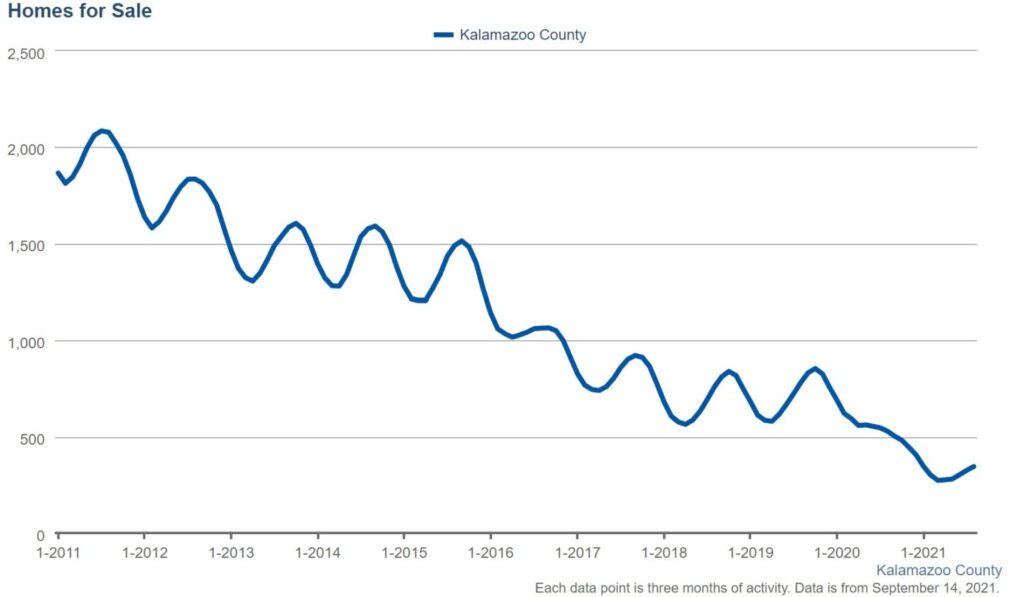
Kalamazoo ended July with only 325 single family and condominium homes on the market. It’s almost impossible to describe how low this is, so we’ll put a graph of the supply of homes over the last 10 years here:
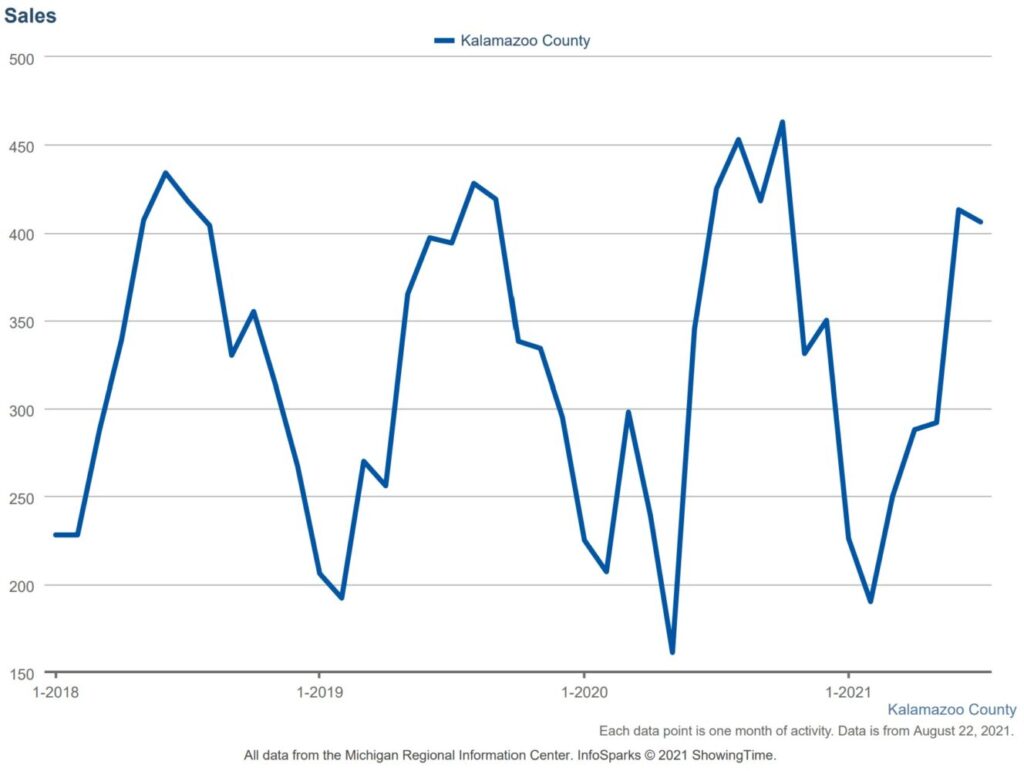
Market Volume Steady
It’s not that we sold more homes; it’s that we started with fewer homes on the market. The total number of home sales was actually LOWER than our typical second quarter.
Market Factors
So, while sales volume is below normal, there are two factors increasing demand:
- Millennials are finally buying homes
- Interest rates are ridiculously low
And two factors limiting supply:
- Baby Boomers aren’t selling their homes
- New construction costs are ridiculously high
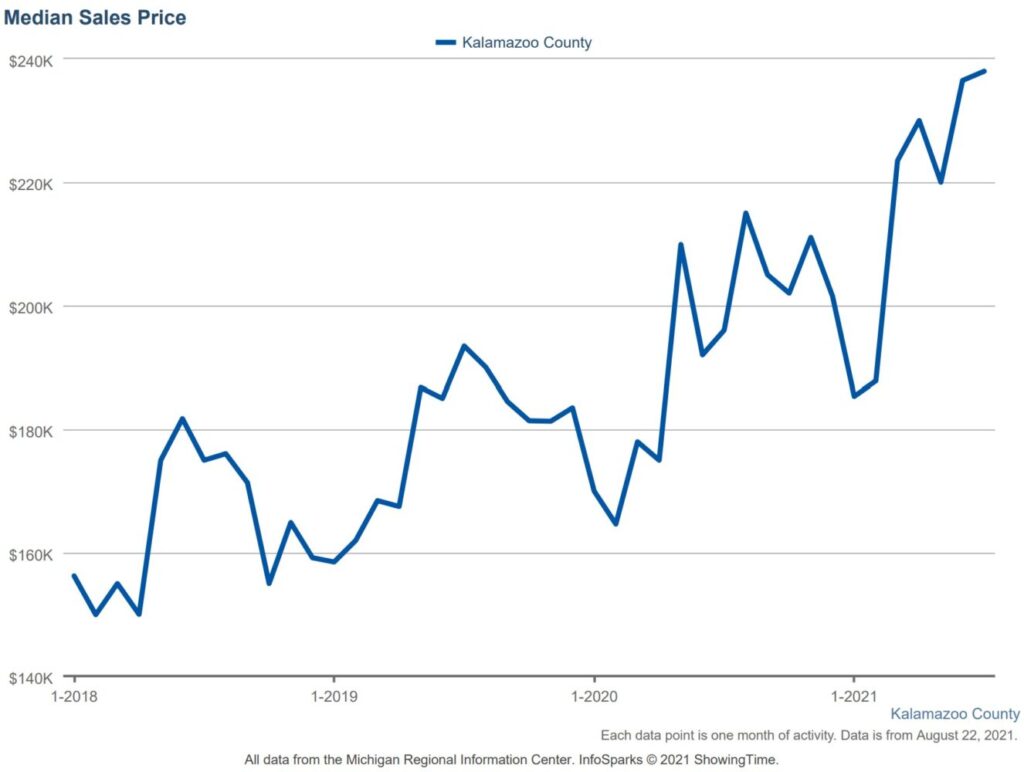
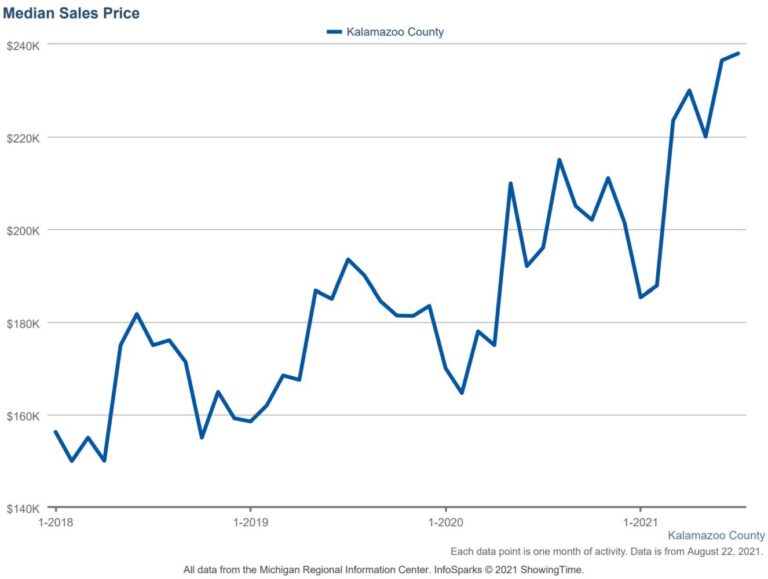
What Did that do to Prices?
The Kalamazoo market saw the median price of a single-family home increase by 21% over one year ago, which is similar to the national trend. However, Kalamazoo’s median price ($235,000) is still far below the national median price ($367,000).
Will Prices Keep Going Up?
I don’t know.
But…the factors that caused the prices to increase this year are still in play. Plus, Stryker, Pfizer, and FedEx are all adding high-paying jobs to the Kalamazoo market.
What Should You Do?
My mentor always told me that you can’t time the market; a home is a lifetime investment, not a commodity to trade. The time to buy or sell a home is when it is right for you.
Kalamazoo County Data
There’s more information below, but feel free to contact us for a market analysis on your home. We take into account your specific market to help you list your home for the right price.
Single Family Stats
| Q2 2020 | Q2 2021 | Change | |
| New Listings | 1,373 | 1,344 | -2% |
| Pending Sales | 1,193 | 1,123 | -6% |
| Closed Sales | 852 | 998 | 17% |
| Days on Market Until Sale | 6 | 4 | -33% |
| Median Sales Price | $194,250 | $235,000 | 21% |
| Average Sales Price | $236,475 | $274,914 | 16% |
| End of Quarter Inventory | 447 | 270 | -40% |
Condominium Stats
| Q2 2020 | Q2 2021 | Change | |
| New Listings | 144 | 130 | -10% |
| Pending Sales | 117 | 112 | -4% |
| Closed Sales | 79 | 115 | 46% |
| Days on Market Until Sale | 19 | 7 | -63% |
| Median Sales Price | $215,900 | $220,000 | 2% |
| Average Sales Price | $231,817 | $241,479 | 4% |
| End of Quarter Inventory | 99 | 55 | -44% |
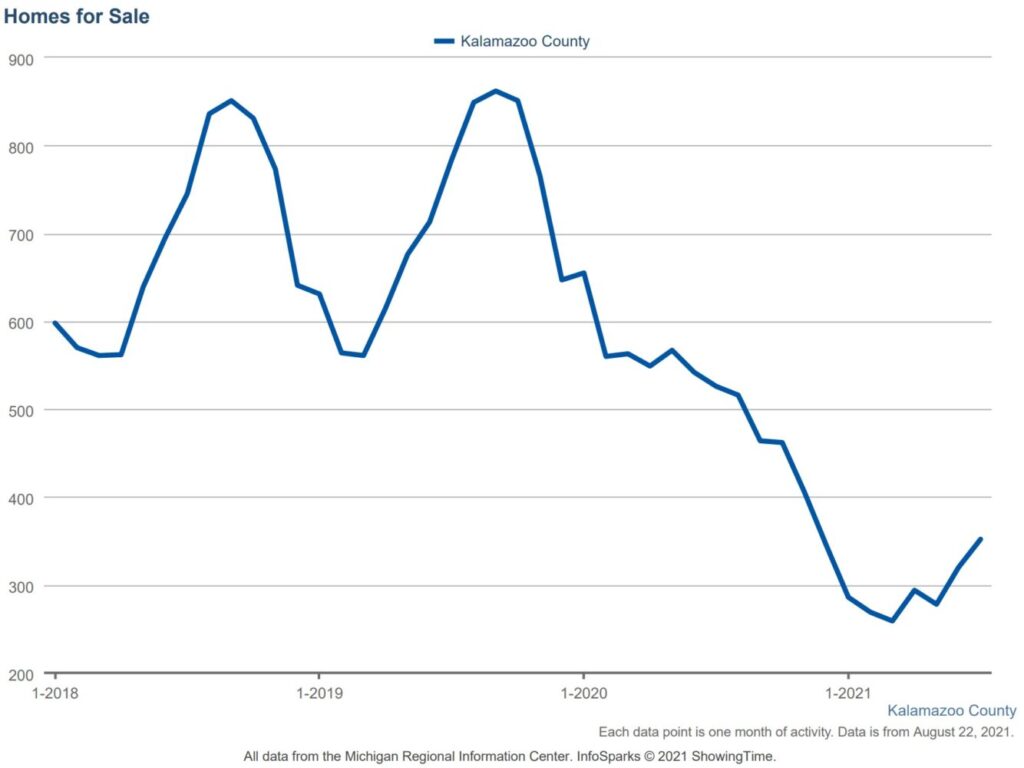
The Number of Listings is Still Down
The Number of Home Sales is Typical for Q2
Median Sales Price Continues to Set Local Records